
Drug Discovery Using XGBoost Regressor Model
Machine Learning and Data Science technologies have started solving some long-unsolved problems, especially in the medical domain. Drug Discovery is one such field that is a very long process because of countless experiments. Due to this, making a new drug takes a lot of time and money. Scientists have been seeking alternative methods to reduce the required costs and funds.
Machine learning has become so advanced that it is being used for Drug Discovery, thus reducing the time needed to produce a new drug. Companies like Google's Deepmind or Elon Musk's Neuralink are heavily investing in discovering the right drug. In this blog, we will develop a step-wise solution for a regression problem of discovering drugs using the XG-Boost regression model.
Key takeaways from this article
We will understand the answer to the following questions in detail:
- Understanding the problem of drug discovery in machine learning.
- What are the various steps involved in drug discovery?
- What steps are involved in building the XGBoost regressor?
- Possible Interview Questions on this topic.
Drug Discovery Problem Understanding and its Practical Use
Bacteria and Viruses cause various diseases in our bodies, and proteins are their primary constituent. During drug discovery, researchers try to understand the effects of various compounds on these proteins so that they can neutralize the presence of bacteria. On the same line, in this blog, we want to identify the compounds with the best effect on a particular target protein; here, in our case, it is Acetylcholinesterase. This protein, AChE, AChase, or acetylhydrolase, is the body's primary cholinesterase.
It is an enzyme that catalyzes the breakdown of acetylcholine and some other choline esters that function as neurotransmitters. And we want to discover a drug to avoid this breakdown. A commonly known disease because of this breakdown is Alzheimer's, where drugs must act on AChE to keep the condition in control.
What are the various steps involved in drug discovery
The drug Discovery project will cover multiple steps, like:
- Discovery of the target protein.
- The lead compound discovery to keep the protein in control and the synthesis pathway.
- Optimization of the drug discovery pipeline.
- Data Accumulation for the relevant effects of various compounds on proteins.
- Repeat the process till the best Compound is found.
Machine learning and deep learning algorithms can solve any of the mentioned steps, e.g., mining proteomics in target discovery, optimizing lead structures for better bioactivity, and analyzing accumulated data at the end of experiments to get a conclusion. In this article, we will build a pipeline to discover the lead Compound to keep the AChE protein in control. We will use the XGBoost regressor model to predict the effect of compounds on this protein.
Steps For Drug Discovery Model Implementation
Step 1: Importing libraries and loading the dataset
We will use the 'Chembl' database, a manually curated database of bioactive compounds with drug-like properties. It contains data on more than 2 million compounds. In Python, there is direct library support for chemblwebresourceclient to get this data.
import pandas as pd
from chembl_webresource_client.new_client import new_client

data = new_client.target
data_query = data.search('acetylcholinesterase')

targets = pd.DataFrame.from_dict(data_query)
Step 2: Understanding the Chembl data
targets.columns

# Index(['cross_references', 'organism', 'pref_name', 'score',
# 'species_group_flag', 'target_chembl_id', 'target_components',
# 'target_type', tax_id'], dtype='object')
Here 'prefname' contains our target name. 'organism' refers to a living being within which this target is present, so it can either be a human or a bird. 'targetchembl_id' refers to the unique id corresponding to the target and from the above 'target' dataframe, we can get the id of 'CHEMBL220' for Human Acetylcholinesterase. We will use this id to retrieve the activity data of different compounds on Human AChE.
data_new = new_client.activity
data1 = data_new.filter(target_chembl_id='CHEMBL220').filter(standard_type="IC50")

df = pd.DataFrame.from_dict(data1)
df.columns

'''
Index(['activity_comment',
'activity_id', 'activity_properties'
'assay_chembl_id',
'assay_description', 'assay type'
'assav variant accession'
'assay_Vartant _mutation','bao endpoint',
'bao _format',
'Thao label'
'canonical smiles'. 'data validity comment',
'document liter descriertofffichenumen',
'document chembl id', 'document Tournal',
'molecule chembl id'
'molecule _pref_name',
'potential duplicate',
'parent_molecule_chembl_id',
'audt units',
'record id',
'pcherbi value',
'relation',
'src_id'
'standard flag'
'standard relation',
'standard text value',
'standard type standard units',
'standard upper value',
'standard _value',
'target_Chembl_id', 'target _organisn',
'target_pref_name'
'target tax id'
'text value' , 'toid', 'type',
'units'
'uo units',
'upper value',
'value'],
type='object")
'''
IC50, a value in the column 'standard_type', is filtered out to make our dataset uniform, and we do not have a mixture of varying biotype units. So, we will only use the data with the biotype unit as IC50.
Some of the important fields in this dataset are:
- 'canonical_smiles': Stores formulas for compounds.
- 'Moleculechemblid': Represents the chembl_id of compounds.
- 'Standard_value': Represents potency, which means the percentage of protein required in water to produce the same inhibition. Hence lower the concentration required, the better. The lower the number, the higher the potency.
Let's analyze this dataset through various visualization techniques. We will start with the histogram of the DataFrame to see the distribution of values. The histogram plot shows that srcid is left-skewed while standardflag is right-skewed.
import matplotlib.pyplot as plt
df.hist()
plt.tight_layout()
plt.show()
Let's draw a heatmap to analyze whether any values are collinearly related.
import seaborn as sns
cmap=sns.diverging_palette(500,10,as_cmap=True)
sns.heatmap(df.corr(),cmap=cmap,center=0,annot=False,square=True)
plt.show()
##convert data type from object to categorical to view further
We might be wondering why only six features were considered in the heatmap above when there are 45 features available in the dataset. It's because many of the "not-included" features are present as "object" types and need to be changed to the "category" type. After that, all features will be considered in the heatmap. The following code tells us how to make changes and rerun the heatmap.
for col in df.columns:
  if(df[col].dtype == 'object'):
    df[col] = df[col].astype('category')
    df[col] = df[col].cat.codes
From the above heatmap, we can analyze that some features are highly colinear, and it will only be wise to use some of them to build our machine-learning model.
Step 3: Data Preprocessing for the AChE dataset
#dropping records which donot have values in columns standard_value and canonical_smiles
df2 = df[df.standard_value.notna()]
df2 = df2[df2.canonical_smiles.notna()]
#dropping records with duplicate canonical_smiles values to keep them unique
df2_unique = df2.drop_duplicates(['canonical_smiles'])
selection = ['molecule_chembl_id','canonical_smiles','standard_value']
df3 = df2_unique[selection]
Feature selection and Modification
We will select three columns for our model: 'canonicalsmiles', 'standardvalue', and 'moleculechemblid'. The rest of the columns will be dropped from the dataset as they did not contain more correlation with our target variable. For 'canonicalsmiles', we will consider unique values to avoid duplicates. Dropping duplicate 'canonicalsmiles' automatically ensures that final records are unique, as the other two fields are set by default when 'canonical_smiles' is fixed.
Feature Transformation
Now, let's convert IC50 to pIC50 to make the values in the 'standard_value' feature more uniformly distributed. This conversion will be done using this transformation formula: pIC50 = -log10(IC50)
Feature Engineering
We have also added a field called 'bioactivity_threshold' to decide whether the Compound is active or inactive.
Class is inactive if standard_value > 10000
Class is active if standard_value < 1000
Active Compound means a small molecule that explicitly inhibits, stimulates, or otherwise alters the production or activity of a Target.
Inactive Compound means any Compound, whether or not covered under claims of a Collaboration Patent, which does not meet the level of activity specified in the definition of Active Compound.
We want only active compounds in our final dataset for practical drug purposes.
Step 4: Exploratory Data Analysis
With our defined criteria of Active and Inactive compounds, what is the distribution of these compounds in our dataset?
import seaborn as sns
sns.countplot(x='bioactivity_class', data=df_2class)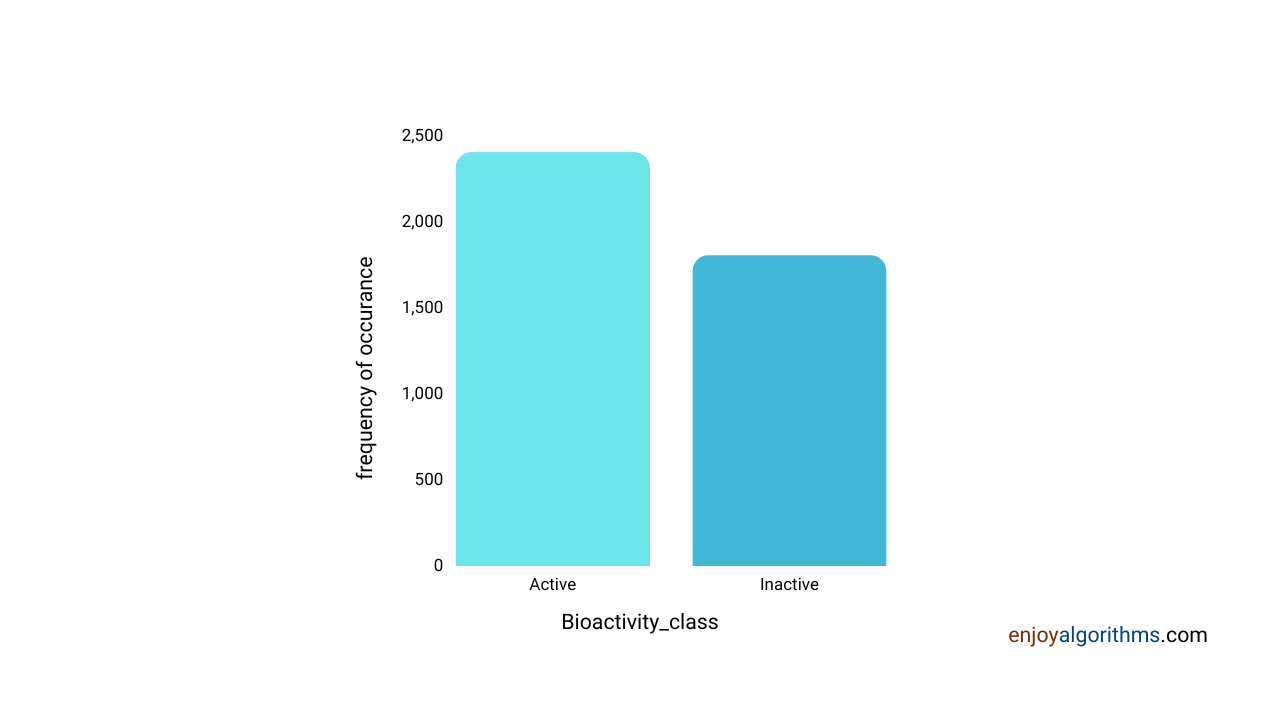
The above graph shows that the dataset is almost balanced for inactive and active compounds, so there would not be any biases.
Also, we know that the machine does not understand categories or text. It only understands binary language or numbers. So let's convert molecular compounds into features that computers can understand.
Step 5: Getting Fingerprints of compounds
We need to convert terms like 'canonical_smiles' into numbers the computer understands. This feature will be converted into fingerprints based on PaDel Descriptor. PaDel Descriptor is software to calculate molecular descriptors and unique identities as fingerprints. For each term, we get a length of 881 fingerprints which consists of 0 and 1. For more details, please see the link here.
Now we have the fingerprints as our input feature vector, i.e., X, and the 'pIC50' field as our target variable Y, which we will try to predict using our machine learning model. Now let's train a model which can help us predict the effect of compounds on AChE.
Step 6: Model Formation
As mentioned, we will use the XGBoost algorithm to solve the drug discovery problem. XGBoost is a famous CART (classification and regression trees) algorithm with an ensemble approach. If you mention this project in your resume, please understand this algorithm's complete theory. One can learn all about this algorithm on our Introduction to XGBoost blog.
import xgboost as xg
from sklearn.model_selection import train_test_split
from sklearn.metrics import mean_squared_error as MSE

X_train, X_test, Y_train, Y_test = train_test_split(X, Y, test_size=0.2)
xgb_r = xg.XGBRegressor(objective ='reg:squarederror',n_estimators = 10, seed = 123)

xgb_r.fit(X_train, Y_train)
Y_pred = xgb_r.predict(X_test)traintestsplit(test_size=0.2) splits data into test and train sets in a ratio of 20:80.
XGBRegressor creates an instance of a regression model based on XGBoost
This will train our model. Now the final step is to evaluate our model on an unseen set.
Step 7: Scatter Plot of Experimental vs Predicted Values
import seaborn as sns
import matplotlib.pyplot as plt
ax = sns.regplot(Y_test, Y_pred)
ax.set_xlabel('Experimental_pIC50')
ax.set_ylabel('Predicted_pIC50')
plt.savefig('prediction_plot2.pdf')
We have solved a regression problem. Hence we will use the error plot to evaluate our model, for example, the Mean Squared Error (MSE) values. Below is the plot to see the scatter plot of predicted vs actual values.
The error is not too low and can evolve later per our needs.
Case Studies Of Companies that use Machine Learning in Medical Science for Drug Discovery
Deepmind: Alphafold
It's a startup acquired and funded by Google that developed an AI system called AlphaFold. It predicts the protein structures in Bacteria and Viruses and uses this prediction to find the antidote.
Exscientia
It is a startup founded in 2012 that developed an AI-powered platform, Centaur Chemist, which identifies potential drug targets and sends them for clinical trials. It currently has 14 patents, of which seven are in the AI domain.
Standigm
It is a South Korean startup founded in 2015 that developed an AI platform, Standigm BEST, which explores latent chemical space to generate novel compounds with desired properties. Also, it analyses literature to identify new drug compounds.
Possible Interview Questions
If we mention this project in our resume, then these are the following questions are likely to be asked in the interview:
- What are regression problems?
- Why XGBoost? What other algorithms can be tried in place of XGBoost?
- What features were used for the final feature set, and what is the reason for that?
- What is the use of fingerprints?
- Do Regression problems have accuracy?
- What is the standard value, and how does it vary wrt compounds' effect on protein?
Conclusion
Machine learning is acting as a lifesaver. It is helping us to reduce the time needed to identify the correct drugs for different diseases. The timely covid vaccine discovery itself is a prominent example of this fact. Today, machine learning and deep learning are involved in every step of drug discovery, from identification to analyzing experimental results. The future scope is tremendous, as we have barely scratched the surface.
Enjoy learning, Enjoy algorithms!
Share Your Insights
More from EnjoyAlgorithms
Self-paced Courses and Blogs
Coding Interview
OOP Concepts
Our Newsletter
Subscribe to get well designed content on data structure and algorithms, machine learning, system design, object orientd programming and math.
©2023 Code Algorithms Pvt. Ltd.
All rights reserved.