
data-science
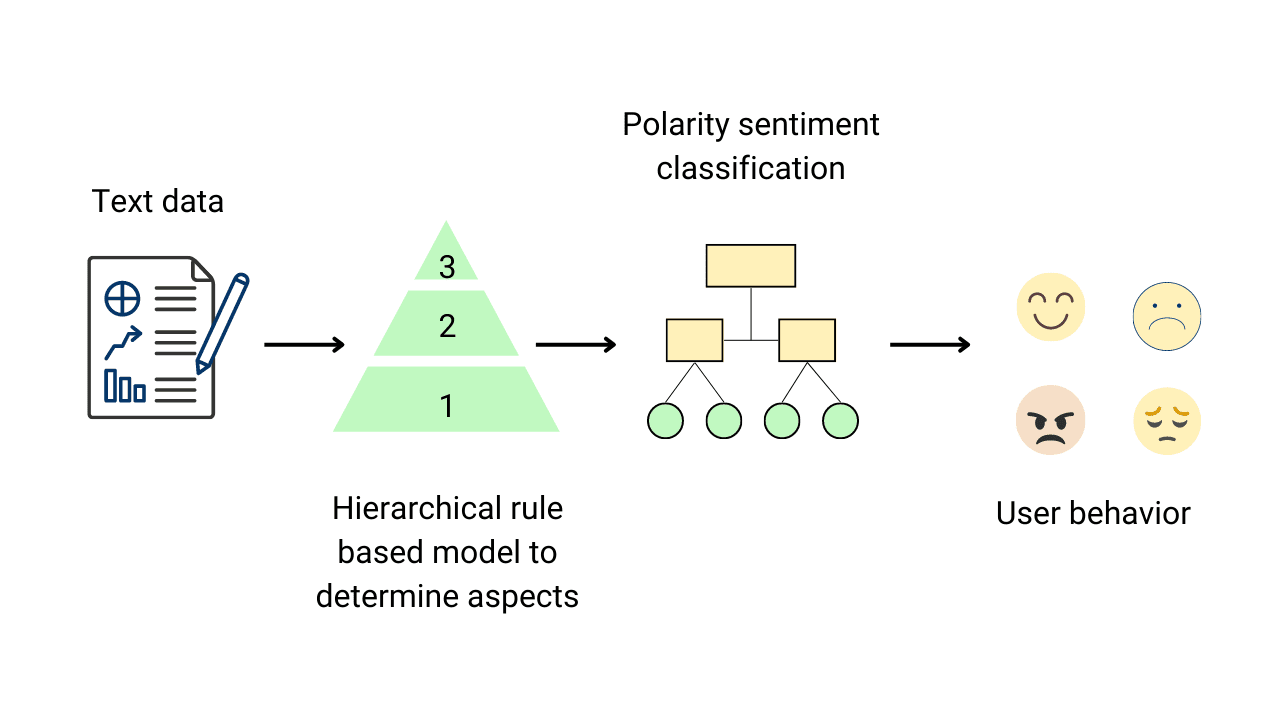
Aspect Based Sentiment Analysis (ABSA) in Python

What is Big Data? Types, Characteristics and Examples
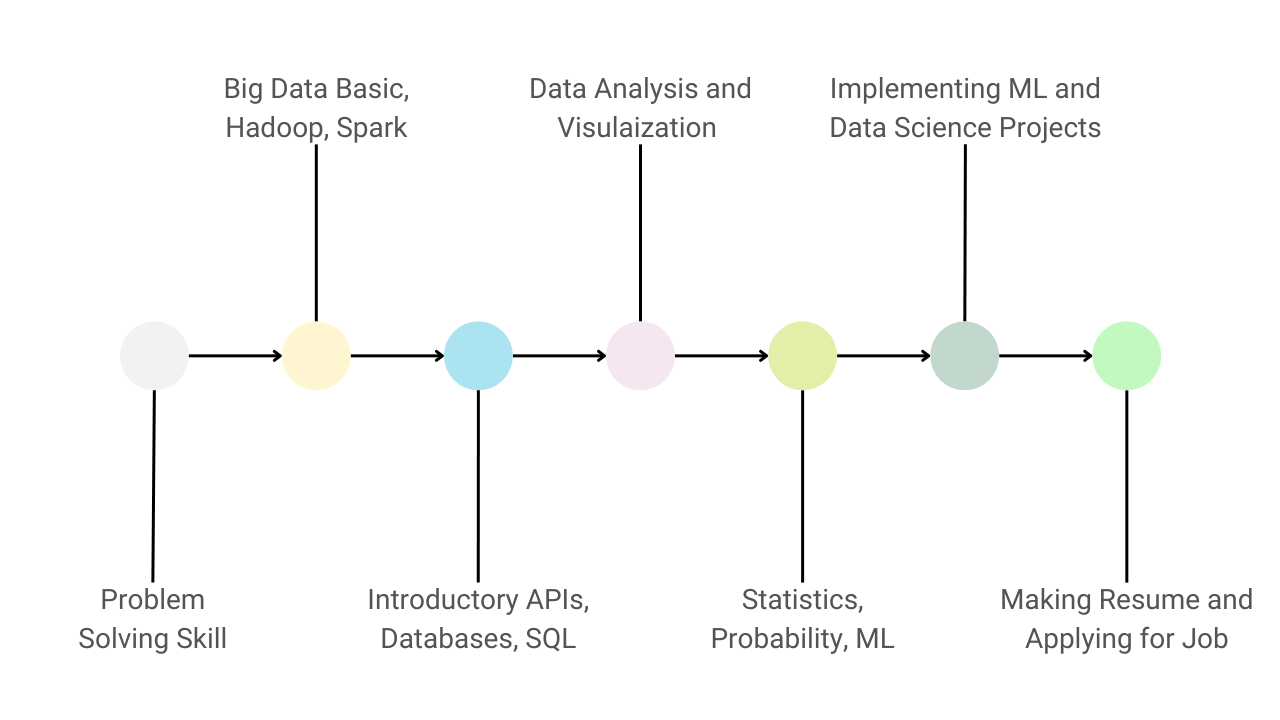
Guide to Learn Data Science and Become a Data Scientist
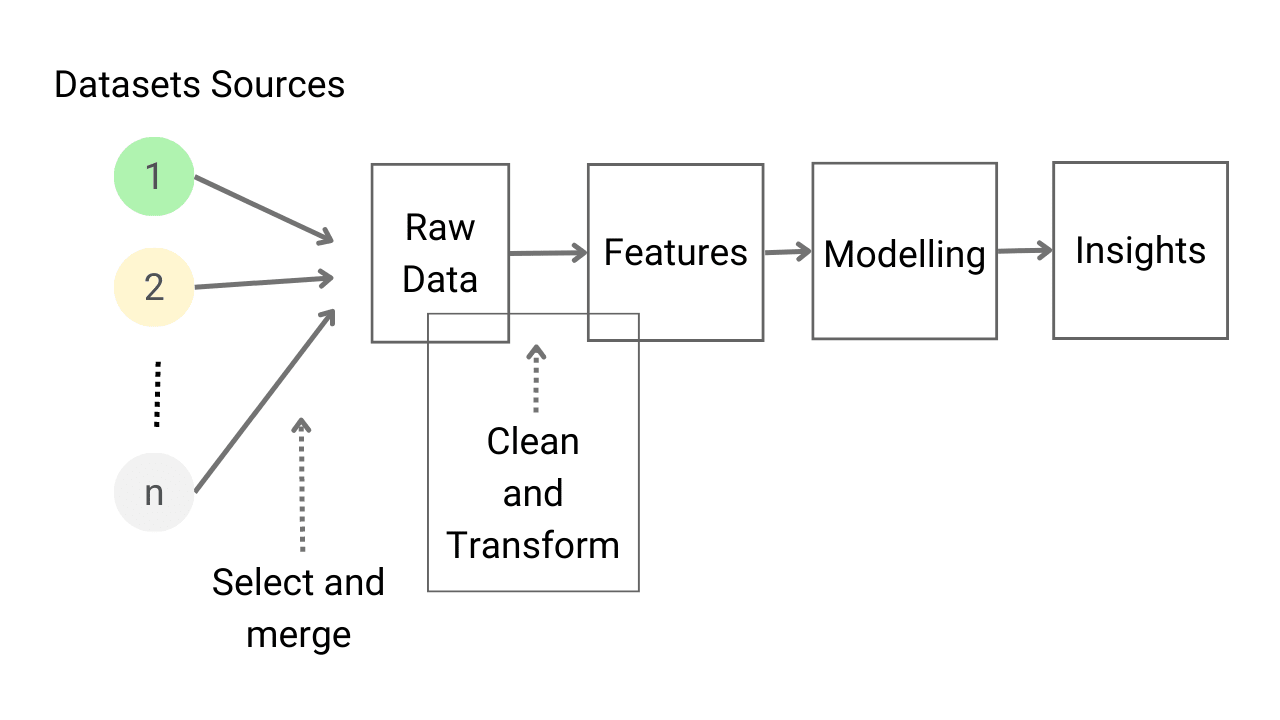
Introduction to Feature Engineering for Machine Learning

Data Types and Variables in Python Programming
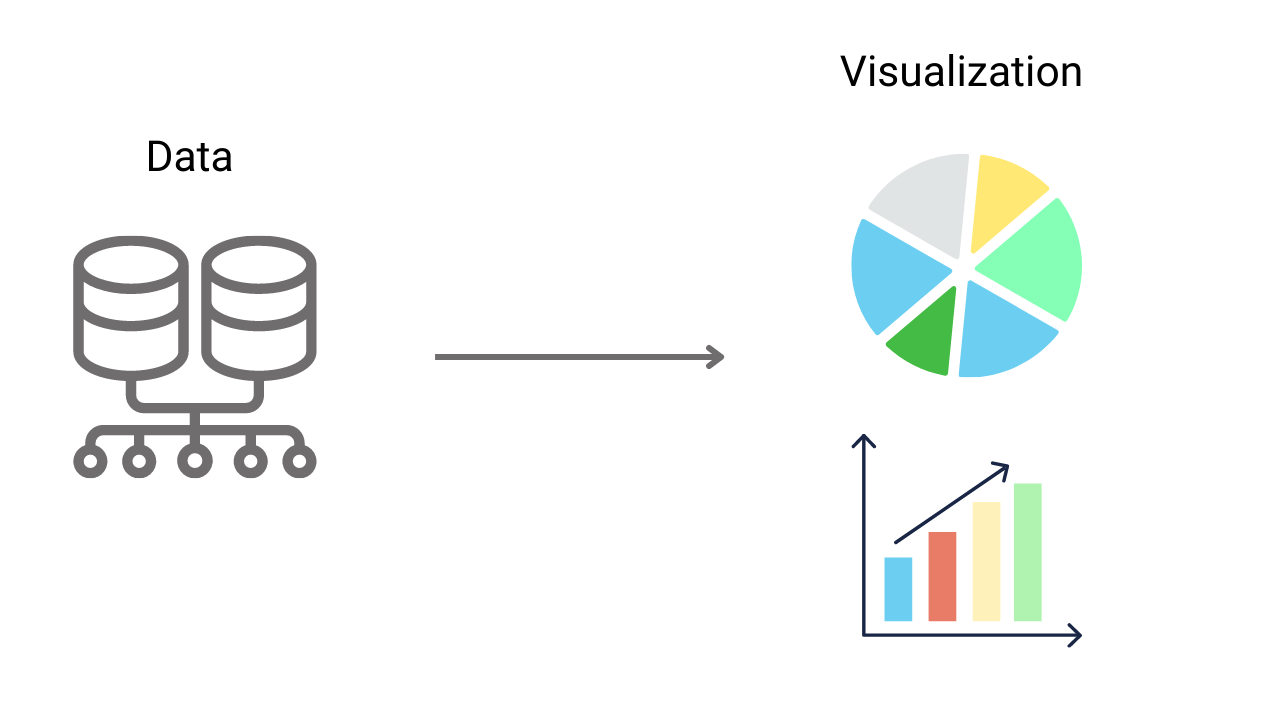
Data Visualization Introduction In Data Science
©2023 Code Algorithms Pvt. Ltd.
All rights reserved.