
Metrics in Software Development
In this article, we will try to answer the above two questions by understanding different situations that we might encounter during software development.
Before starting with metrics, let’s understand the importance of logs in our code. Assume we work as programmers in a bank and we need to write a service that processes credit card payments. On a high level, to accomplish this we will need to complete the following tasks:
- accept input containing user information and credit card information,
- validate the input provided (fields expected are non-null, etc.),
- verify that the credit card is actually registered in the user’s name,
- verify that cvv and expiry provided are correct,
- verify that user has not exceeded their credit card limit,
- process the payment and return the result (success or failure)
As a developer, most probably we will not be expected to write code for each of the above functionality. What we will need to do instead is integrate our new service with existing services that already provide the solution to the above use cases. Assume the following are the four services that are available to us:
- M1 : takes input and validates it
- M2 : verifies that the credit card is actually registered in the user’s name and returns a secret token (input for M3) corresponding to the unique user-credit card combination
- M3 : takes as input the secret token (received from M2 for the corresponding user-credit card combination) and verifies that cvv and expiry provided are correct for the credit card
- M4 : verifies that user has not exceeded their credit card limit
Now when our service receives a request for payment processing, it will first make a request to M1 to validate the input. Based on M1’s response, it will either proceed with payment processing or return a failure response. Similarly, after making a request to M1, the new service will make a request to M2, then M3, then M4, and will finally process the payment if everything works as expected.
Now that we have created our service, we launch it in a production environment and it is available for payment processing. Assume after a day we start getting complaints that the service is returning failure responses even though the user and credit card information is correct. Now, what do we do? How do we go about debugging our application? This is why we need logs in our code and without them, it would be almost impossible to debug the issues.
Assume we had put logs at the start and end of every method in our code. Now when we check the logs (on AWS CloudWatch or in a file system or anywhere else), we find that we have the logs for “Inside method foo()” but logs for “Returning from method foo()” are missing (a better way would be to use AOP).
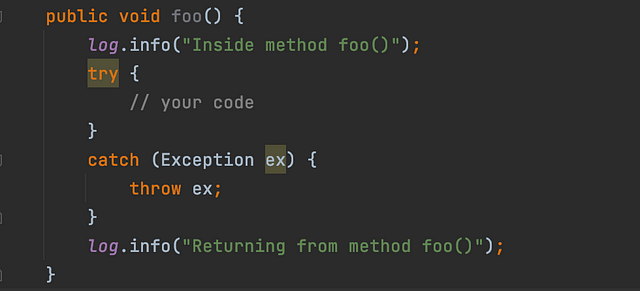
This at least gives us an idea that something is failing inside this method. This way, we can reduce the search space from thousands of lines of code to maybe 50–60 lines of code. This is just one of the many examples where logs might save us from wasting days of effort in debugging issues.
Now if logs can help us debug our code then why would we need metrics?
Let’s consider a different scenario. Assume we completed writing the code (as efficiently as possible) for our service. We also tested our code and it worked fine. Now we launch our service in production and again everything works fine. However, after a few days, we start getting complaints from users that our service is too slow. It’s difficult to believe as we know that we have not made any recent changes to the code. We decide to check the latency ourselves (for example, by making a request via postman) and it indeed seems to be too high. So we decide to check the logs but everything in the logs is also as expected. Now we are unsure of what our next steps should be to decrease this latency because we do not even know the cause. Now we start suspecting different entities involved. One of us argues that it could be the load balancer that could be causing the issues while someone else blames the internet architecture. Whatever be the argument, we still don’t know what to do next.
This is where metrics come in. We will talk about what they are but first assume that we had the following graphs available to us:
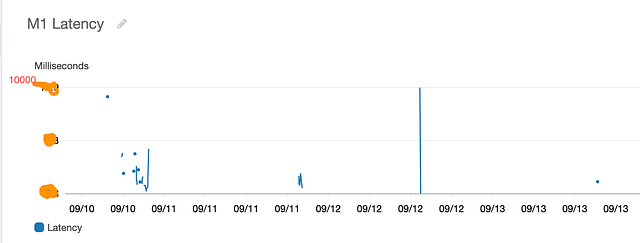
M1 Latency
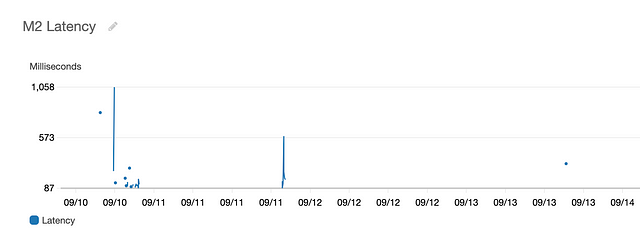
M2 Latency
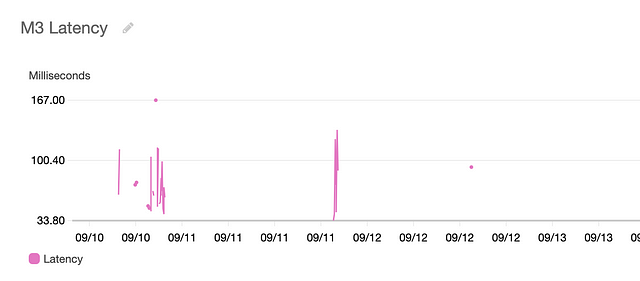
M3 Latency
M4 Latency
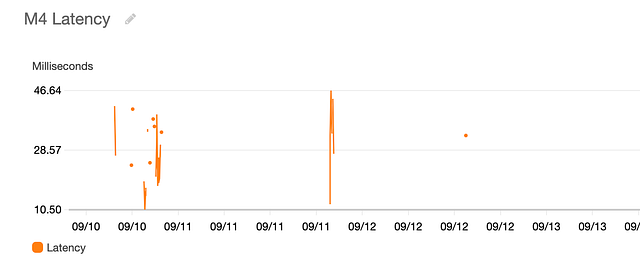
And now just by looking at the graphs, we are able to see that M1 service is the cause of high latency (sometimes taking as long as 10 seconds (in practice, a request should timeout if latency is this high)), and it’s not the load balancer and internet architecture after all. Thus, maybe owners of service M1 made a recent change to their code which caused the issue of high latency.
If we consider the time one would take to find the cause of latency by looking at these graphs vs the time someone spends by exploring different options figuring out the cause of latency, I think the difference would be in days if not months. Thus, metrics and logs turn out to be invaluable when debugging issues or analyzing the performance of our applications.
Now the question is how do we get these graphs? This is where metrics come in. We can consider metrics to be variables and data points as values for those variables over time. And the graphs above represent a statistical aggregation (sum, average, max, min, p99, or any other stat) of the values of the variable over time. Let’s try to simplify this further.
To get the metrics, we need to publish data points from our code. For this our code might look like this:
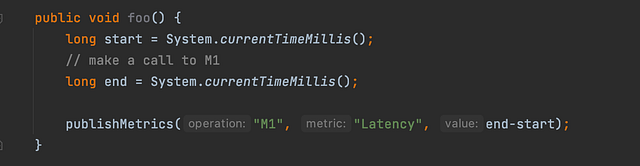
Now for each call to M1, using the above code we are publishing the time it takes for M1 to process our request. Every time we publish a metric, it is like putting a value to a variable at that time. Now when we have values for the variable over time, we can apply aggregations over them. For instance, we can calculate the average latency for every 5 minute period for the last 3 days. Here the period of 5 minutes tells us the time for which we need to consider the data points while aggregating the values. Like calculate average latency for the data points published between12.00 am to 12.05 am, then 12.05 am to 12.10 am, then 12.10 am to 12.15 am, and so on. And do this for every 5 minute period over the last 3 days.
Similarly, we can plot the graph for the maximum latency that we can expect from different services. If we know how our dependencies are performing, we can set the right expectations with our customers.
There are many other scenarios where metrics help us, and it’s up to us how we leverage them. For instance, it’s also possible to set up alarms on the metrics — like send the development team an email when the average latency (calculated over a period of 5 minutes) from any of the services breaches a threshold of 1 second.
If we would have had similar alarms from the start for our service, we might have debugged and fixed the issue before it became rampant and customers were affected by it. It would have saved a lot of time and trust if we would have fixed the issue before it even surfaced to the customers.
Share Your Insights
Self-paced Courses and Blogs
Coding Interview
OOP Concepts
Our Newsletter
Subscribe to get well designed content on data structure and algorithms, machine learning, system design, object orientd programming and math.
©2023 Code Algorithms Pvt. Ltd.
All rights reserved.