
Introduction to Loss and Cost Function in Machine Learning
In Machine Learning, computers provide solutions to various problem statements, ranging from recommending better products to full-fledged autonomous vehicles. But how do we convey these problem statements to computers that only understand binary? If we tear down the exact problem statement machine solves in ML, we will get that it is nothing but an Optimization problem.
Optimization is the sole of Machine learning algorithms, as most ML problems get reduced to functions that need to be optimized. But what exactly is there to optimize in ML? In this article, we will find the answer to this question.
Key takeaways from this blog
After going through this blog, we will be familiar with
- What is the loss function, and why is it important?
- What are the various loss functions used for regression tasks? Descriptions of Absolute loss, Square loss, and Huber loss.
- What are the various loss functions used for binary classification tasks? Descriptions of Binary cross-entropy and Hinge loss.
- What are the loss functions used for multi-class classification tasks? Description of Categorical cross-entropy.
Before moving further, let’s define the term loss function and quickly review one famous optimization algorithm, gradient descent.
What is Loss Function in ML?
In the supervised learning approach, whenever we build any machine learning model, we try to minimize the error between the predictions made by our ML model and the corresponding true labels present in the data. Computers understand this error through defined loss functions.
For example, we are designing an email spam classifier model via our machine learning algorithms. The focus is to ensure that any new email in our inbox must be accurately categorized with spam or non-spam tag. But how do we check that this categorization is happening correctly? If some important mail gets labelled spam, we might lose critical communication.
That’s where the role of the loss function comes into the picture. We try to frame our problem statement in the form of numbers such that computers understand what exactly they need to do.
There are thousands of data samples in the raw data, and one might think the error is calculated for every data sample. Which sample should we target to get the required loss value? There comes the concept of the cost function in machine learning.
What is the Cost function in ML?
In Machine Learning, we have multiple observations using which we train our machines to solve a particular problem statement. The cost function is nothing but the average of the loss values coming from all the data samples.
Difference between Loss and Cost Function
We usually consider both terms synonyms and can use them interchangeably. But, the Loss function is associated with every training example, and the cost function is the average of the loss function values over all the data samples. In Machine learning, we optimize our cost rather than our loss function.
Why is the choice of the perfect loss function important?
There is one famous quote in Neural Smithing Book: “It is important that the function faithfully represent our design goals. If we choose a poor error function in machine learning and obtain unsatisfactory results, the fault is ours for badly specifying the goal of the search.”
Loss functions translate our needs from machine learning in a mathematical or statistical form. If we know what exactly we want to achieve, it will make the process easier.
In computer science, whenever we say that we need to reduce the cost, it becomes an optimization problem. Machine Learning is similar here. Hence, before moving forward, let’s quickly revise one famous optimization algorithm, i.e., the Gradient descent algorithm.
Quick Revision of Gradient Descent
Suppose J(θ) is the loss function and θ is the parameters the machine learning model will learn. We are selecting a continuous loss function, and the model wants to learn those parameters for which the cost will be minimal. But how will the model reach those parametric values? That’s where we need some optimization algorithm to optimize our cost function.
Gradient descent is quite a famous optimization algorithm in machine learning, so let’s see how it works.
The overall process of the Gradient Descent algorithm
- Initialize the weight values randomly.
- Partially differentiate the cost function G = ∂J(θ)/∂θ w.r.t different parameters constituting the cost function.
- Update the weights by an amount proportional to the gradient to ensure that loss reduces in each iteration, θ = θ — α.G. Here α is the learning rate parameter which is considered a vital hyperparameter in deciding how fast the parameters’ updates should happen.
- Repeat the process of updation until the difference in values of the cost function between two consecutive iterations (e.g. 100th and 101st iteration) goes below the pre-defined threshold. For example, suppose we defined that threshold as 0.0005. After the 100th update, the cost function gives a value of 1.007; after the 101st update, it gives a value of 1.0071. The difference between the cost function values for two consecutive iterations is 0.0001; hence we can stop the updation process now.


Now we know about this optimization algorithm, let’s continue learning about the cost functions. As stated earlier, the cost function reflects our requirements in numbers, and we can customize it per our requirements. But it will become a bottleneck if we start designing cost functions catered to every problem statement. Hence, there are some traditional in-built cost functions in Machine Learning.
Based on the nature of the problem statement, we categorize machine learning models into three classes:
- Classification
- Regression
- Clustering
But clustering is not a supervised learning approach. So we have two cases left: Regression and Classification problem statements. Let’s discuss some readymade loss functions available in these categories.
Loss Functions In Regression Problems
In regression tasks, we try to predict the continuous target variables. Suppose we are trying to fit the function f using machine learning on the training data X = [X1, X2,…, Xn] so that f(x) fits Y = [Y1, Y2,…, Yn]. But this function “f” may not be perfect, and the fitting will have errors. To quantify this error, we can use these readymade loss functions:
Square Error
Square error is also called L2 loss; the formula is below. We are squaring the difference between Yi {the actual value} and f(xi) {corresponding predicted value}.

If we observe this loss function, it’s a quadratic equation with only a global minimum and no local minimum, which can be considered a mathematical advantage. The unavailability of local minima ensures that our gradient descent algorithm does not fall into that local minimum trap, and we will have the most optimal parameters. Hence, the square error is one of the most favourable loss functions among data scientists and machine learning professionals.

The corresponding cost function will be the average of these losses for all the data samples, called Mean Squared Error (MSE). MSE is a very famous cost function in the ML industry.

If we look at the update term of gradient descent, θ = θ — α.G, we infer that for higher values of error, we will have larger values of the gradient (dj/dθ). It means the higher the loss; the more changes will happen in the parameter. Or we can also say: more penalization will occur when the error is higher. But this can be problematic when there are outliers in the dataset. Outlier samples can adversely affect MSE.
Limitations of MSE: The difference between actual and predicted will be higher, and squaring that difference will make them even more prominent. So MSE is less robust to the outlier’s presence, and it is advised not to use MSE when there are too many outliers in the dataset.
Absolute Error
Absolute error is also called L1 loss. Unlike MSE, here, we take the absolute value of the error rather than squaring it.

The corresponding cost function will be the average of the absolute losses over training samples, called the Mean Absolute Error (MAE). It is also widely used in industries, especially when the training data is more prone to outliers.

Limitations of MAE: Although MAE is frequently used, it is a non-differentiable function, so we need more complicated techniques to find the gradients and update the parameters. When the cost values approach minimum, the gradient becomes undefined, making MAE unstable.
Huber Loss
L1 and L2 losses are prevalent, but they have limitations.
- L1 loss is more robust to outliers than L2, or we can say that when the difference is higher, L1 is more stable than L2.
- L2 loss is more stable than the L1 loss, especially when the difference between prediction and actual is smaller.
Huber loss takes the good from L1 and L2 and avoids their shortcomings. It is shown mathematically in the image below.

It is quadratic for smaller errors and becomes linear for higher values of errors. The distance where we transit the behaviour is controlled by a parameter δ, which characterizes the Huber loss function.
Loss Functions In Classification Problems
In classification tasks, we try to predict the categorical values instead of continuous ones for the target variables. For example, we want to classify incoming emails as spam or non-spam.
To predict the categorical variables, we take the help of probability theory or probability distribution functions. Suppose our ML classification model says that email is spam with a probability of 0.9. In that case, the model is 90% confident about its prediction; hence this mail should be categorized as spam. If the true value is also spam, the error will be zero. But if the model somehow misclassifies it, then the error value will be 1. This kind of error calculation will always give us discrete values and make our cost function non-differentiable.
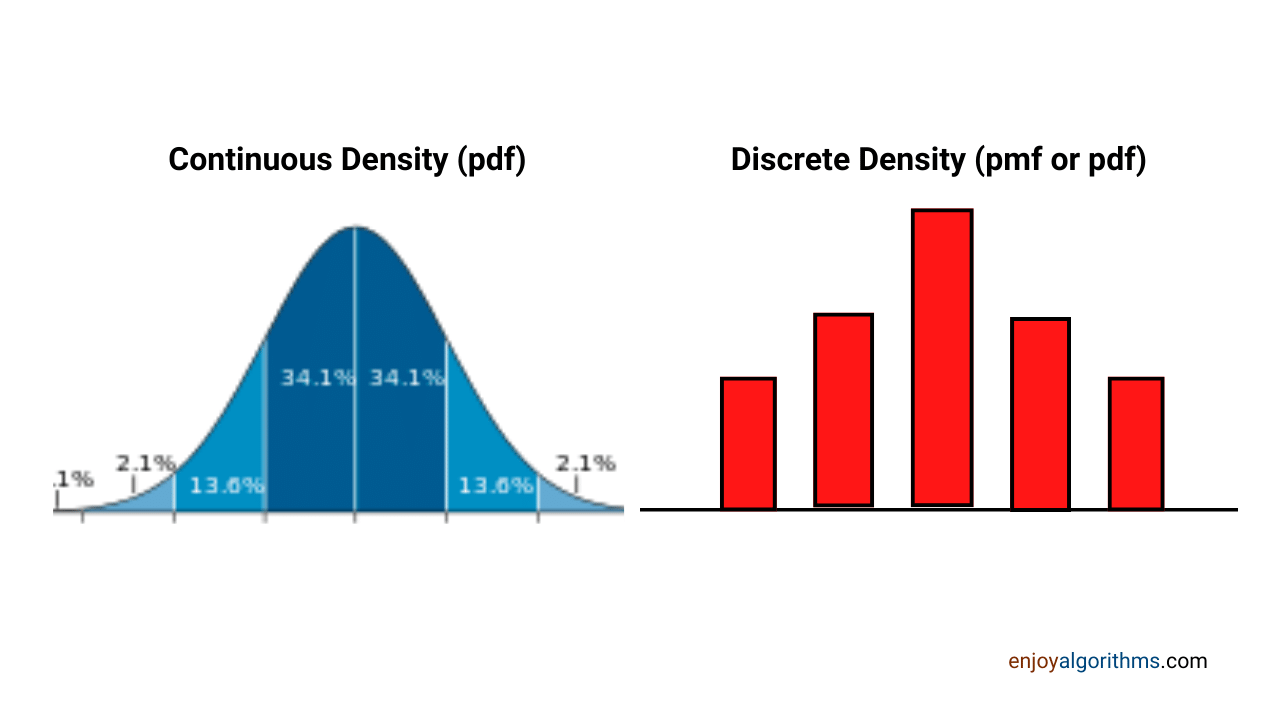
To tackle this situation, we treat the predicted probabilities as the samples coming from one probability density function and actual probabilities coming from another. The objective is to make sure that these PDFs match. But before going any further, let’s understand the term entropy first.
Entropy in Loss Functions
Entropy signifies uncertainty (something not certain). In thermodynamics, we measure the entropy of particles because their position is not specific. Similarly, for a random variable X coming from a probability distribution p(X), entropy is defined as:

 If the entropy value is higher, the surety about random variable X following that distribution will be lesser. When the entropy is lower, the confidence or surety will be higher.
Based on the number of categories present in the data, we have two types of entropies:
1. Binary Cross-Entropy
Here we have the target variables in the binary format, or only two classes are present. If the probability of being in class 1 is P, then the probability of being in class 2 will be (1-P).
Cross entropy loss for the actual label of Y (which can take values of either 0 or 1) and the predicted probability of P can be defined as,

This loss is also known as the Log loss. Let’s understand this via one example of email spam and non-spam classification. Here is a table containing 5 samples with actual probabilities (Y) and the corresponding predicted probabilities (P). When Y is 0, we need to correct the predicted values with 1-P. Negative logs for all these corrected values are the loss for each sample.
S.N | Actual (Y)   |  Predicted (P)      |   Corrected        |  Log of corrected |

  1 |    1         |       0.97          |         0.97       |   -0.0132
  2 |    0         |       0.9           |         0.1        |   -1
  3 |    1         |       0.59          |         0.59       |   -0.229
  4 |    1         |       0.37          |         0.37       |  -0.432
  5 |    0         |       0.1           |         0.9        |  -0.0457
We will read about this loss in greater detail when discussing the logistic regression algorithm in machine learning. We generate the values of P using the sigmoid function because the values of the sigmoid lie in (0, 1) and become the perfect candidate to generate probability values as probability also lies in (0, 1).

We can define the corresponding cost function as:

2. Categorical Cross-Entropy
Here we have the categorical variables in the form of multiple classes. The entropy calculation will remain the same, but the Y vector will be represented as the One-hot encoded vector. Suppose there are three classes Cat, Dog, and nocatno_dog. One-hot representation of these classes can be,
Cat = [1,0,0], Dog = [0,1,0], nocatno_dog = [0,0,1].

C = total classes/categories
Here, Yij will be in one-hot vector representation form, and Pij will be the predicted probability for being in class j when the i-th sample of input (Xi) is provided. Unlike binary cases, we use the softmax function to calculate Pij. To understand this softmax function, let’s assume there are three categories, as mentioned in the earlier example. If our model says that it is 90% sure that it is a cat and 70% sure that it is a dog, and 50% sure that it is neither a cat nor a dog, then what should be our final prediction?
To answer this, we apply the softmax function to all these confidence values (Zi’s in the below formula) such that the sum of confidence becomes 1 and starts resembling probability. Once “softmaxed,” the class corresponding to the highest probability will be our final model’s predicted category.

Note: The sum of all these values of σi will be 1 because the denominator and numerator will become identical.
Special Loss for SVM: Hinge Loss
This loss function is only used with Support Vector Machines or Maximal Margin Classifiers, with classes -1 and 1 ( Not 0 and 1). SVM is a machine learning algorithm specially used for binary classification and uses decision boundaries to separate two types.
The image above separates red and green samples by the solid middle line. The dotted lines represent the support vectors in SVM, and if the distance of samples is higher from these dotted lines, the model will be more confident towards the categorization. We will learn it deeply after discussing the SVM topic in detail.
But one thing to remember for SVM is that Hinge loss penalizes the wrong predictions and the predictions for which the model is less confident.

Here Yi and f(Xi) are not probability values but a dot product to estimate the distance of predicted values for sample Xi from the actual value Yi.

It is a non-differentiable function but possesses a convex nature, which helps find the optimal loss. The convex nature of the loss function is necessary to have a stable minimum.
Possible Interview Questions on Loss/Cost Functions in ML
Cost and loss functions are among machine learning interviews’ most frequently asked topics. Interviewers mainly focus on checking the understanding of how ML works:
- What different loss functions did you try in your regression problem statement, and why did you finalize the one?
- What is Hinge loss, and why is it different from others?
- What is the difference between binary cross-entropy and categorical cross-entropy?
- What is the difference between the cost function and the loss function?
- If Huber loss is better, why do we generally see MSE and MAE as cost functions?
Answer: Huber loss increases the time complexity of our algorithm, and it brings an additional hyperparameter δ for which tuning is required.
Conclusion
In this article, we learned several loss functions which are highly popular in the machine learning domain. We learned different loss functions used in classification: binary cross-entropy, categorical cross-entropy, and the special hinge loss used in Support Vector Machines and Regression: square loss, absolute loss, and Huber loss. This has cleared all the confusion about when to choose which loss function.
Enjoy Learning, Enjoy Algorithms!
Share Your Insights
More from EnjoyAlgorithms
Self-paced Courses and Blogs
Coding Interview
OOP Concepts
Our Newsletter
Subscribe to get well designed content on data structure and algorithms, machine learning, system design, object orientd programming and math.
©2023 Code Algorithms Pvt. Ltd.
All rights reserved.